Since just over a week ago we have begun to see reports of changes to figures on deaths due to COVID-19 in many countries. The changes typically lead to upward revision of the death figures, and usually this seems to occur either because the daily reporting of deaths has not incorporated deaths occurring outside of hospitals, or because national organizations are catching up on deaths that are not due to COVID-19 and discovering large changes in non-COVID death patterns. For example, on 17th April we started to see reports that Wuhan city had increased its death count by about 50%, and today we find the BMJ reporting that deaths in care homes in the UK have increased rapidly. Of course as soon as China revises its figures we see accusations of cover-ups, and no doubt people are also wondering if the institutions in some hard-affected countries are competent enough to accurately report death figures. So in this post I want to explain a little about how these mortality data are collected, how deaths are reported, why figures can be suddenly revised, and what some of the data we’re seeing means, using British data revisions as an example.
How death data is collected
For people living in high-income countries it may come as something of a surprise to learn that vital registration systems – the systems that record births and deaths – are not actually very sophisticated or high-tech, and that for many countries they do not exist at all. In high-income countries these systems are often legacy systems, based on a network of paper-based reporting that is still quite far behind the needs of modern information-hungry media, and many countries have no such systems in place: the WHO estimates that 2/3 of all deaths that occur every year are not recorded in any registration system. In a pandemic like this, where media organizations want to report daily death numbers, the traditional systems in place to register deaths often cannot keep up.
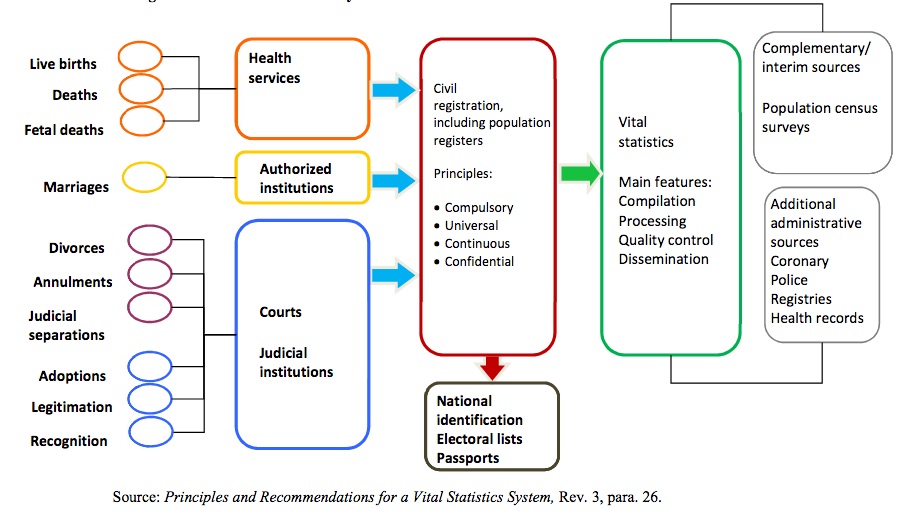
Typically a vital registration system takes some time to update. After someone dies a doctor has to assign a cause of death, which in many cases will be recorded on a piece of paper that has to then be input into a computer system and slowly passed up a chain to a central authority, where it will be checked and certain data cleaning activities undertaken. In many cases the doctor’s original cause of death recording doesn’t make sense, so some checks have to be conducted to make sure that things are working. Then whatever the doctor wrote down has to be converted into a standardized cause of death (under the International Classification of Diseases) and entered into a database by its code, along with whatever local codings (for place of death, geocoding, etc) that the national jurisdiction calls for. Figure 1 (taken from the UN Stats handbook) shows the stages of the flow of vital registration.
Many countries lack some or all stages of this process: for example, China still does not have a complete vital registration system, and mortality estimates are based on sample surveys outside of major cities[1]. In many countries deaths occurring in different locations may be processed at very different speeds, with death in prison, homes or elderly care facilities being reported much more slowly than in hospitals, and rural hospitals or smaller clinics reporting more slowly than major regional or teaching hospitals. When people want to know rapidly how many people are dying in a fast-evolving situation it is unlikely that we will get complete mortality estimates, and usually the only data that the health service can aggregate quickly is data on in-hospital deaths. It can take weeks, months or even a full year to obtain a full, accurate snapshot of mortality figures across the entire community. As an example, this Kaiser Foundation report on care-home deaths due to COVID-19 in the USA makes clear that there are very large differences in how completely death data is collected between states in the US, and differences in how rapidly that data is reported. Oregon, for example, presents fairly comprehensive data on cases and mortality in residents and staff, but only on a weekly basis. But 55% of deaths reported in Oregon occurred in care facilities, which likely means that the death data in Oregon is delayed by a week and there will likely be revisions to earlier totals that slip by in the rush to report information.
When media report daily deaths, what they are really doing is taking data in a relatively raw form from the first orange box (“Health services”) in figure 1, before a proper civil registration and vital statistics quality control process has been implemented. Then, subsequently, national statistical authorities release the actual figures, which can be much larger than those initial estimates, and require some large and rather embarrassing changes to the numbers. This is particularly likely if – as in the UK – care homes are understaffed and use primarily unskilled labour. During a pandemic that targets elderly people, those facilities are likely to be way too busy to process mortality data in the timely fashion the media demand!
How deaths are recorded
Another important part of the puzzle is how deaths are actually recorded. Death statistics are recorded in three different forms: the direct cause of death, which actually made the person die; contributing causes of death, which may have helped them along the line; and the underlying cause of death, which is the real reason they died. This is a matter of medicine and biology, not always easily determined: for example diabetes might be the underlying cause of death, there may have been a contributing factor from pneumonia, and the direct cause may have been some kind of organ failure. You can see this process in action in the example blue forms provided by the CDC. When a death is finally reported by the government the underlying cause will be reported, not the contributing cause; but in the case of a major pandemic we may have good reason to think that the death would not have happened without the contribution of COVID-19. Furthermore, deaths are certified by doctors, and there is not necessarily a common agreement on when something is underlying, direct or contributing, and death certificates can be notoriously low quality. This creates problems for assessments of mortality patterns generally, but it is particularly important when giving rapid assessments of mortality due to a disease that we still don’t properly understand, since a judgment about whether something contributed to or was the underlying cause of death requires a basic understanding of how that cause works. This can lead to repeated reassessments of numbers of deaths, as doctors change their understanding of how the disease kills and what comorbidities might be vulnerable to the disease.
When you see a change in mortality figures it will be because of either or both of these problems. It could arise because a new source of causes of death has finally been cleaned and added to the data; it could be that a computer system had to be updated to allow daily death records to include COVID-19; or it could be because experts decided that certain events that had previously seemed independent of COVID-19 were actually related; or it could be because the government decided to include (or exclude!) deaths where COVID-19 was a contributing (rather than underlying) cause of death.
Another possible reason for changes in death figures, and a very serious one, is that the daily figures media received were those on deaths due to confirmed COVID-19, which are accurate and precise, but that after a few weeks the statutory authorities realized that there had been a huge increase in non-COVID deaths due to pressure on the health system, and started recording those too. This is what has started to happen in Europe, and this is what we will examine using the UK as our base.
Sudden huge increase in mortality in the UK
The Office of National Statistics has finally been able to compile, clean and release the data on all causes of death in the UK over the past few weeks, and the findings are stark. In week 16 of this year (11-17 April) there were 22,351 deaths in the UK. This is 11,854 more deaths than the five year average for that week. Basically, the number of deaths in the UK in that week doubled. There were 8,756 deaths due to COVID-19 in that week, which suggests about 3,000 deaths occurred due to non-COVID causes, an excess mortality rate of about 30%. So in one week in April, the number of deaths in the UK doubled, and only 70% of those excess deaths were due to COVID-19: the other 30% were other causes which, I think it’s safe to assume, occurred because of pressure on the health system.
This ONS report also notes that for the whole year so far there have been 22,000 or so excess deaths compared to the five year average, an increase of about 10%. COVID-19 has been in full force in the UK for just 3-4 weeks, and it has already increased the year-to-date mortality rate by 10%. That was based on figures that are already basically two weeks old, so we can expect that with 3-4 more weeks of deaths still to come, the year-to-date mortality rate will increase even more – but we won’t know for a few more weeks because of the delay in reporting at-home deaths. Figure 2 (taken from the ONS report) shows this in stark relief.
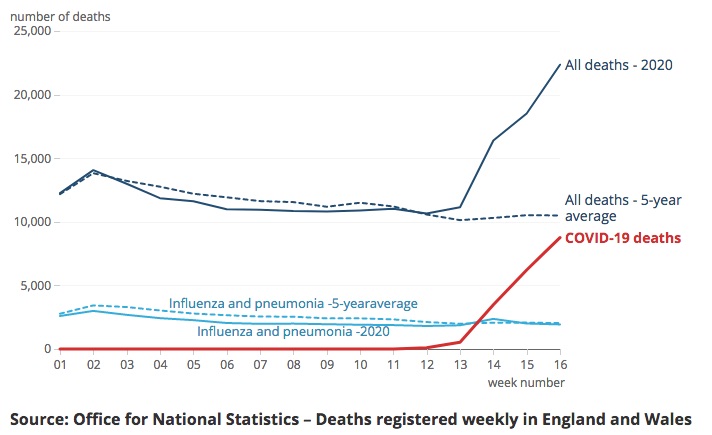
I hope those lines in Figure 2 make very clear that COVID-19 is not “just flu” and that its impact on the UK population has been staggering. Had the government pursued its foolish “herd immunity” strategy things would have been much, much worse.
I hope this two-week-after-the-fact revision will help my reader(s) to understand that the adjustments that were made to Wuhan’s mortality figures 10 days ago are not unusual or evidence of any kind of cover up: it’s natural that a health system that is struggling to deal with a sudden massive surge in hospitalizations and deaths, and which already does not have a well-functioning mortality registration system, is going to miss some deaths on the initial pass, and is going to need a bit of time to collect all the data and make it available in a comprehensive format. Over the next few weeks we will see this happening in a lot of health systems, and additional components of COVID-19 mortality will become clearer as time passes. This does not reflect incompetence or dishonesty, just the efforts of a system that was designed for slow, annual stocktake-type processes to adapt to a rapidly-changing pandemic situation.
This also means that we should expect that the figures we see now are not the final toll of this virus. Whatever numbers we’re seeing now from the USA, for example, we should expect to grow considerably once the CDC has had the chance to compile all the separate, confusing sources of data and put together a comprehensive report.
And when they do that, it’s going to be bad. Very, very bad. This disease is very dangerous, and without major action on the part of every country it is going to exact a terrible toll.
Stay home and stay safe, people!
fn1: Like all things in China, this is changing rapidly, and the quality of mortality statistics regularly improving. The linked article is from 2015 and is probably already out of date.

Leave a comment